1Central Institute of Mental Health, Medical Faculty Mannheim, University of Heidelberg 2University of Hamburg & Max Planck UCL Centre for Computational Psychiatry and Aging Research, Berlin *Corresponding author
Detecting neural replay non-invasively in humans is hard, and the methods used for it have lacked a validation against a known ground truth. We present FASTIMAGES, a benchmark dataset of seventy participants with parallel fMRI (n = 40) and MEG (n = 30) recordings containing known neural sequences evoked by fast visual stimulation. Using these data we evaluate two sequence-detection methods — Temporally Delayed Linear Modelling (TDLM) for MEG and Slope Order Dynamic Analysis (SODA) for fMRI. Both excel in their native modality with comparable effect sizes, whereas cross-modality transfer remains challenging. FASTIMAGES offers data with known, clearly expressed sequences as a shared reference point to validate future methods.
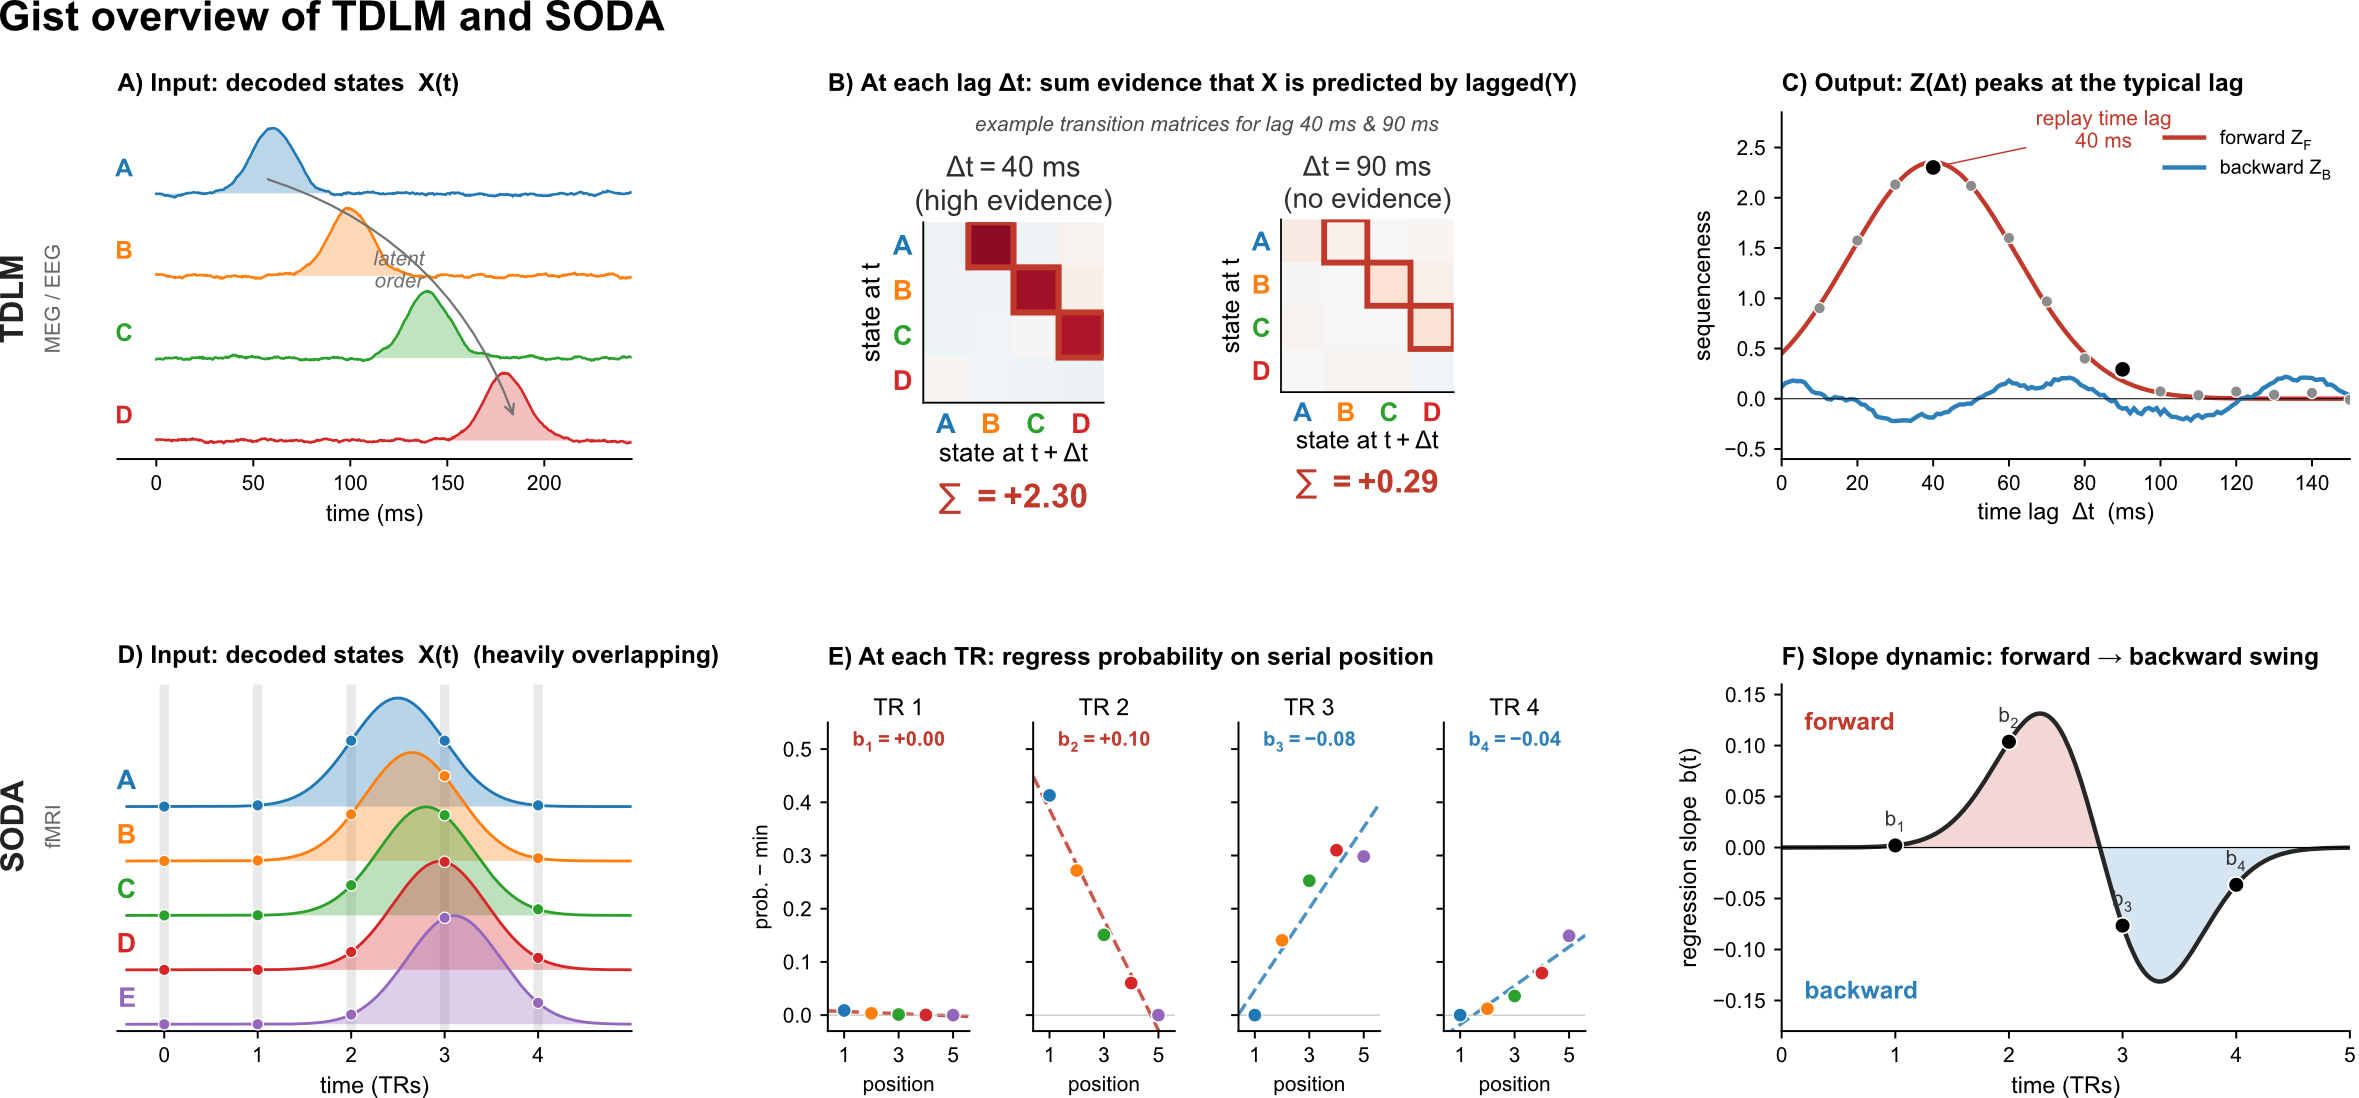
Both methods first use a brain decoder to estimate, at every time point, how strongly each stimulus is currently "reactivated", and then test whether those reactivations follow an expected sequence.
TDLM (developed for MEG) works like a Granger causality: it tests whether reactivation of one item predicts reactivation of the next item at a constant time lag, yielding a "sequenceness" score per lag. It assumes brief, temporally separated reactivation peaks and a high sampling rate.
SODA (developed for fMRI) exploits the slow, overlapping hemodynamic response: it regresses item probabilities onto their sequence position at each measurement, producing a slope that is expected to be negative during an onset period and positive during an offset period.
Figure 1. Visualization of TDLM (top) and SODA (bottom), each shown within its native measurement modality.
The FASTIMAGES paradigm
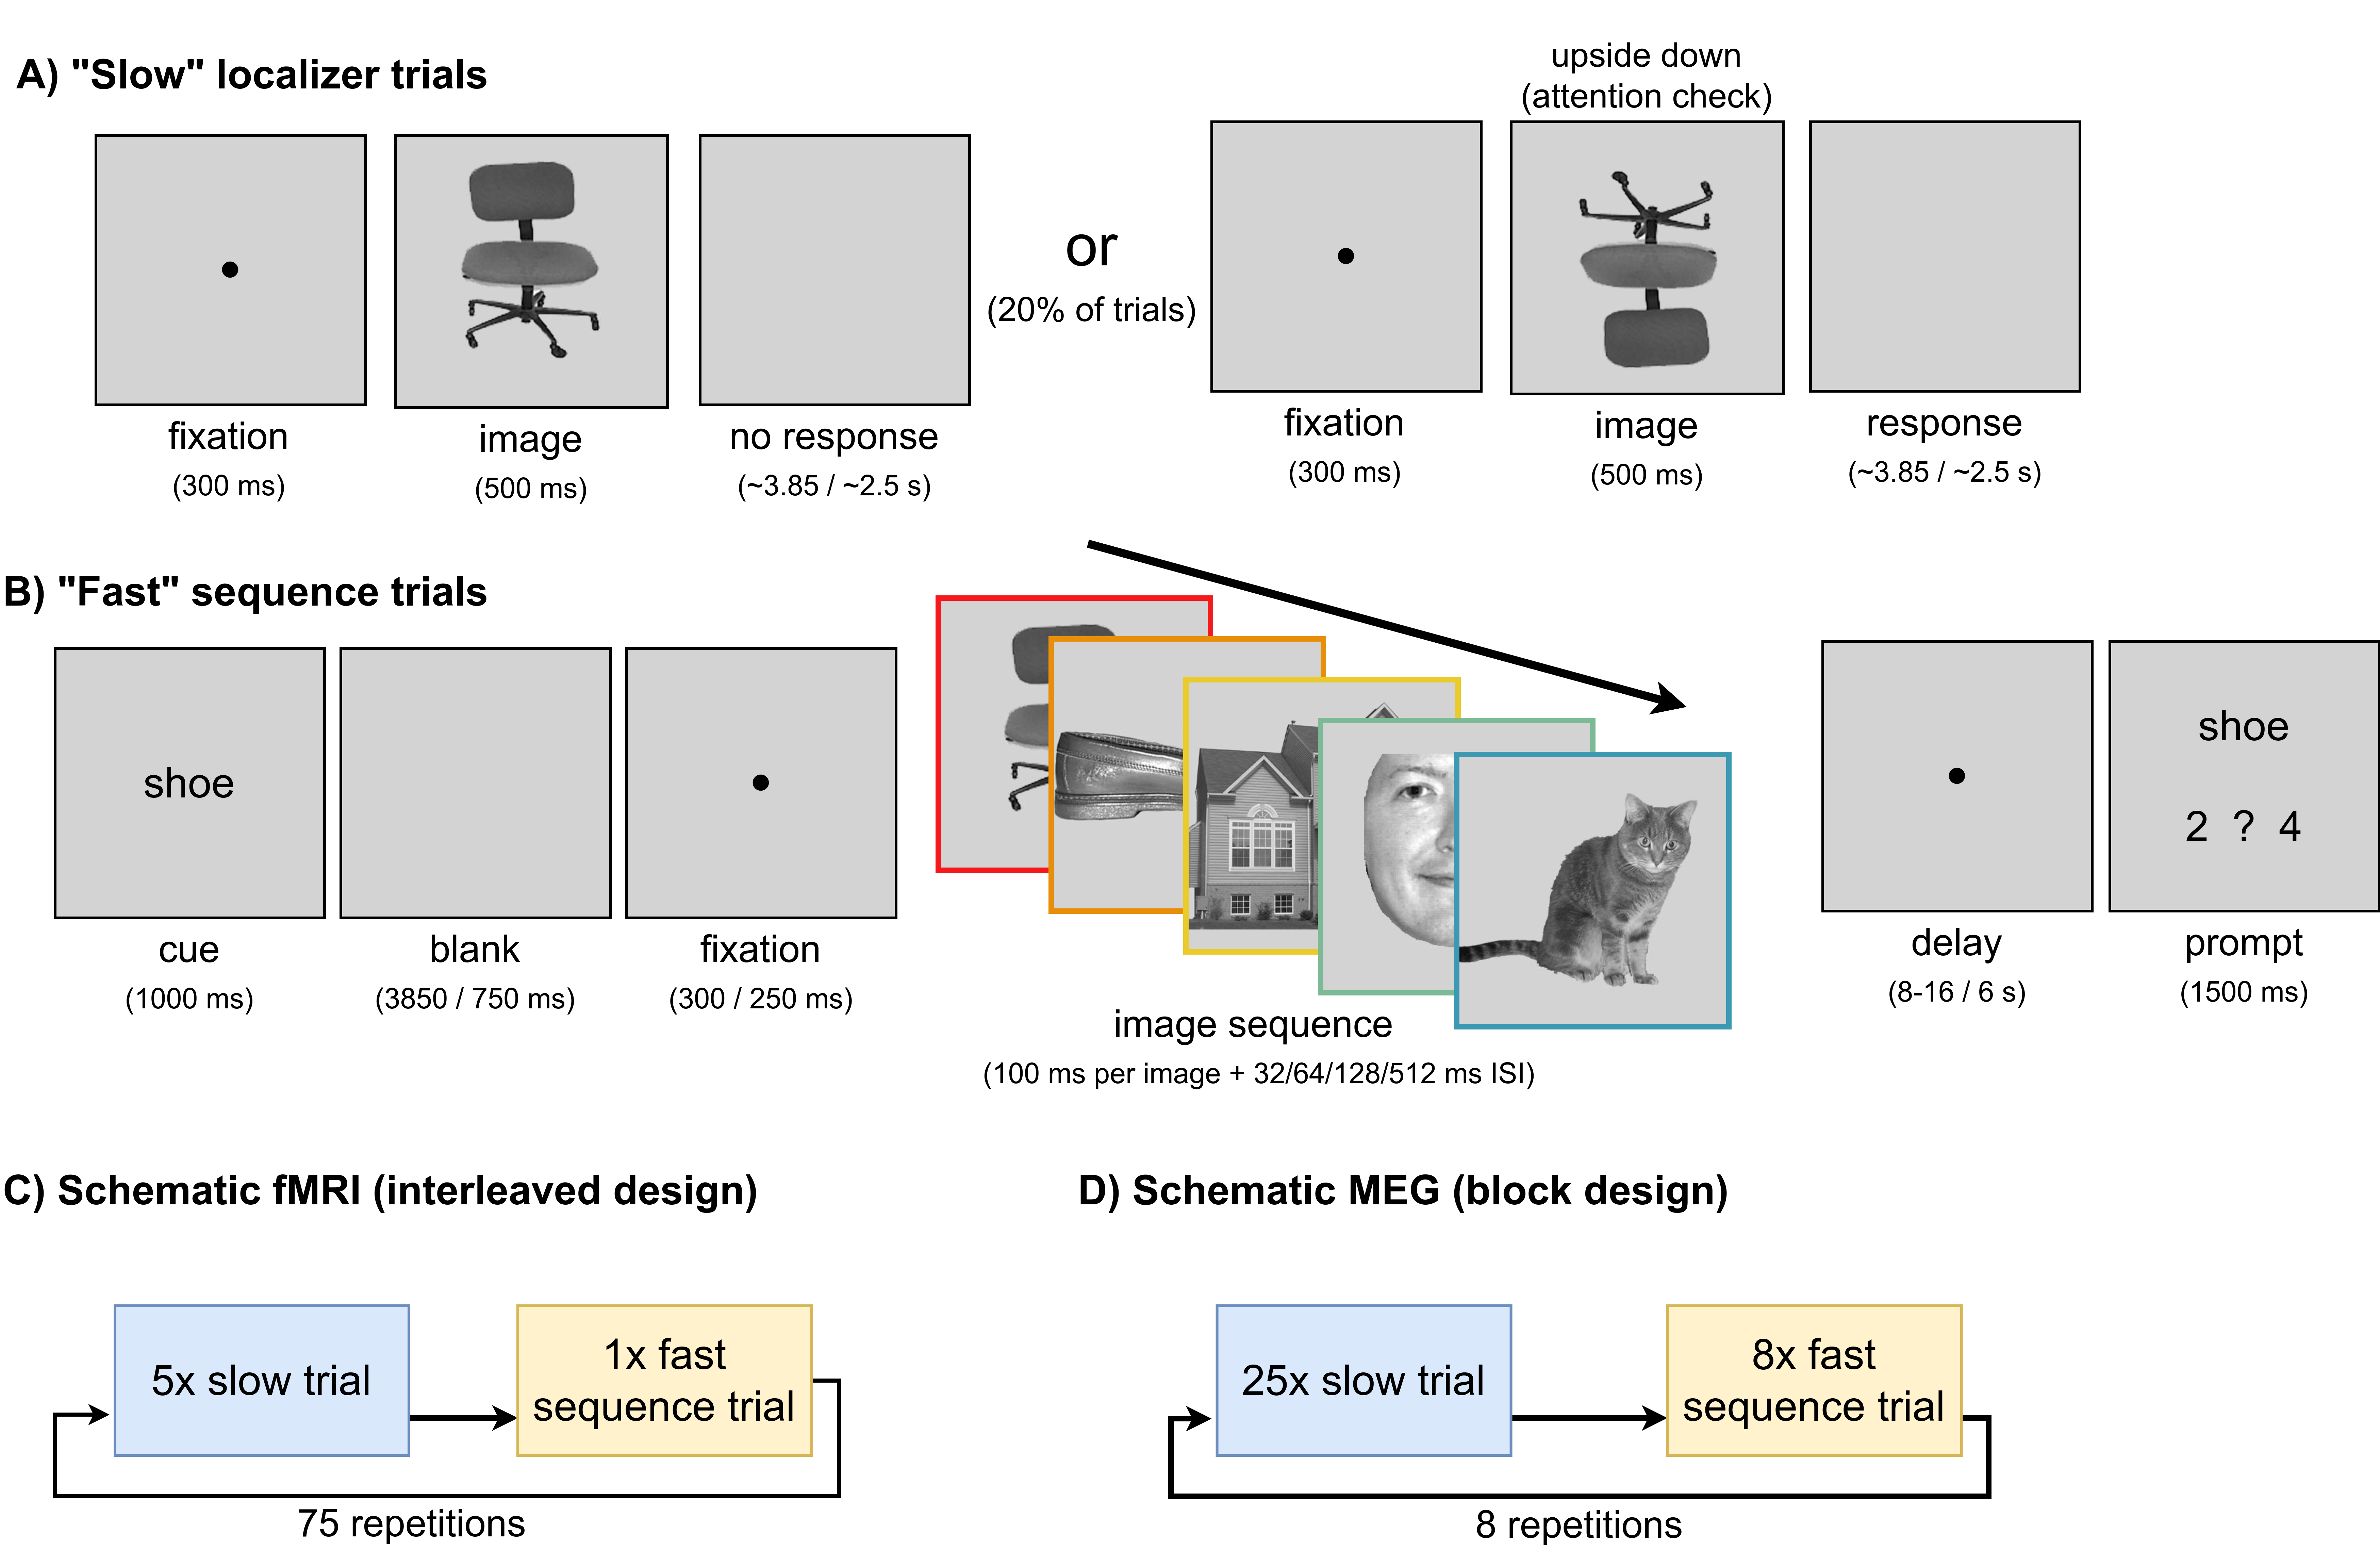
Seventy participants viewed grayscale images from five categories (house, cat, chair, face, shoe) in two task types:
Slow localizer trials — single images shown for 500 ms, used to train per-category decoders. Participants reported upside-down images as an attention check.
Fast sequence trials — all five images shown in rapid succession (100 ms each) with a fixed inter-stimulus interval per trial, creating a known ground-truth neural sequence. Participants reported the serial position of a cued image.
Figure 2. The two paradigm types and the differences between the fMRI and MEG implementations. Sequence onset-to-onset intervals were 132, 164, 228 and 612 ms (the fMRI additionally recorded a slower condition).
The two task types, as seen by participants on screen:
Slow localizer trial — single images shown one at a time to train the decoders.
Fast sequence trial — all five images flashed in rapid succession, creating the ground-truth neural sequence.
Results summary
A benchmark with clearly expressed neural sequences
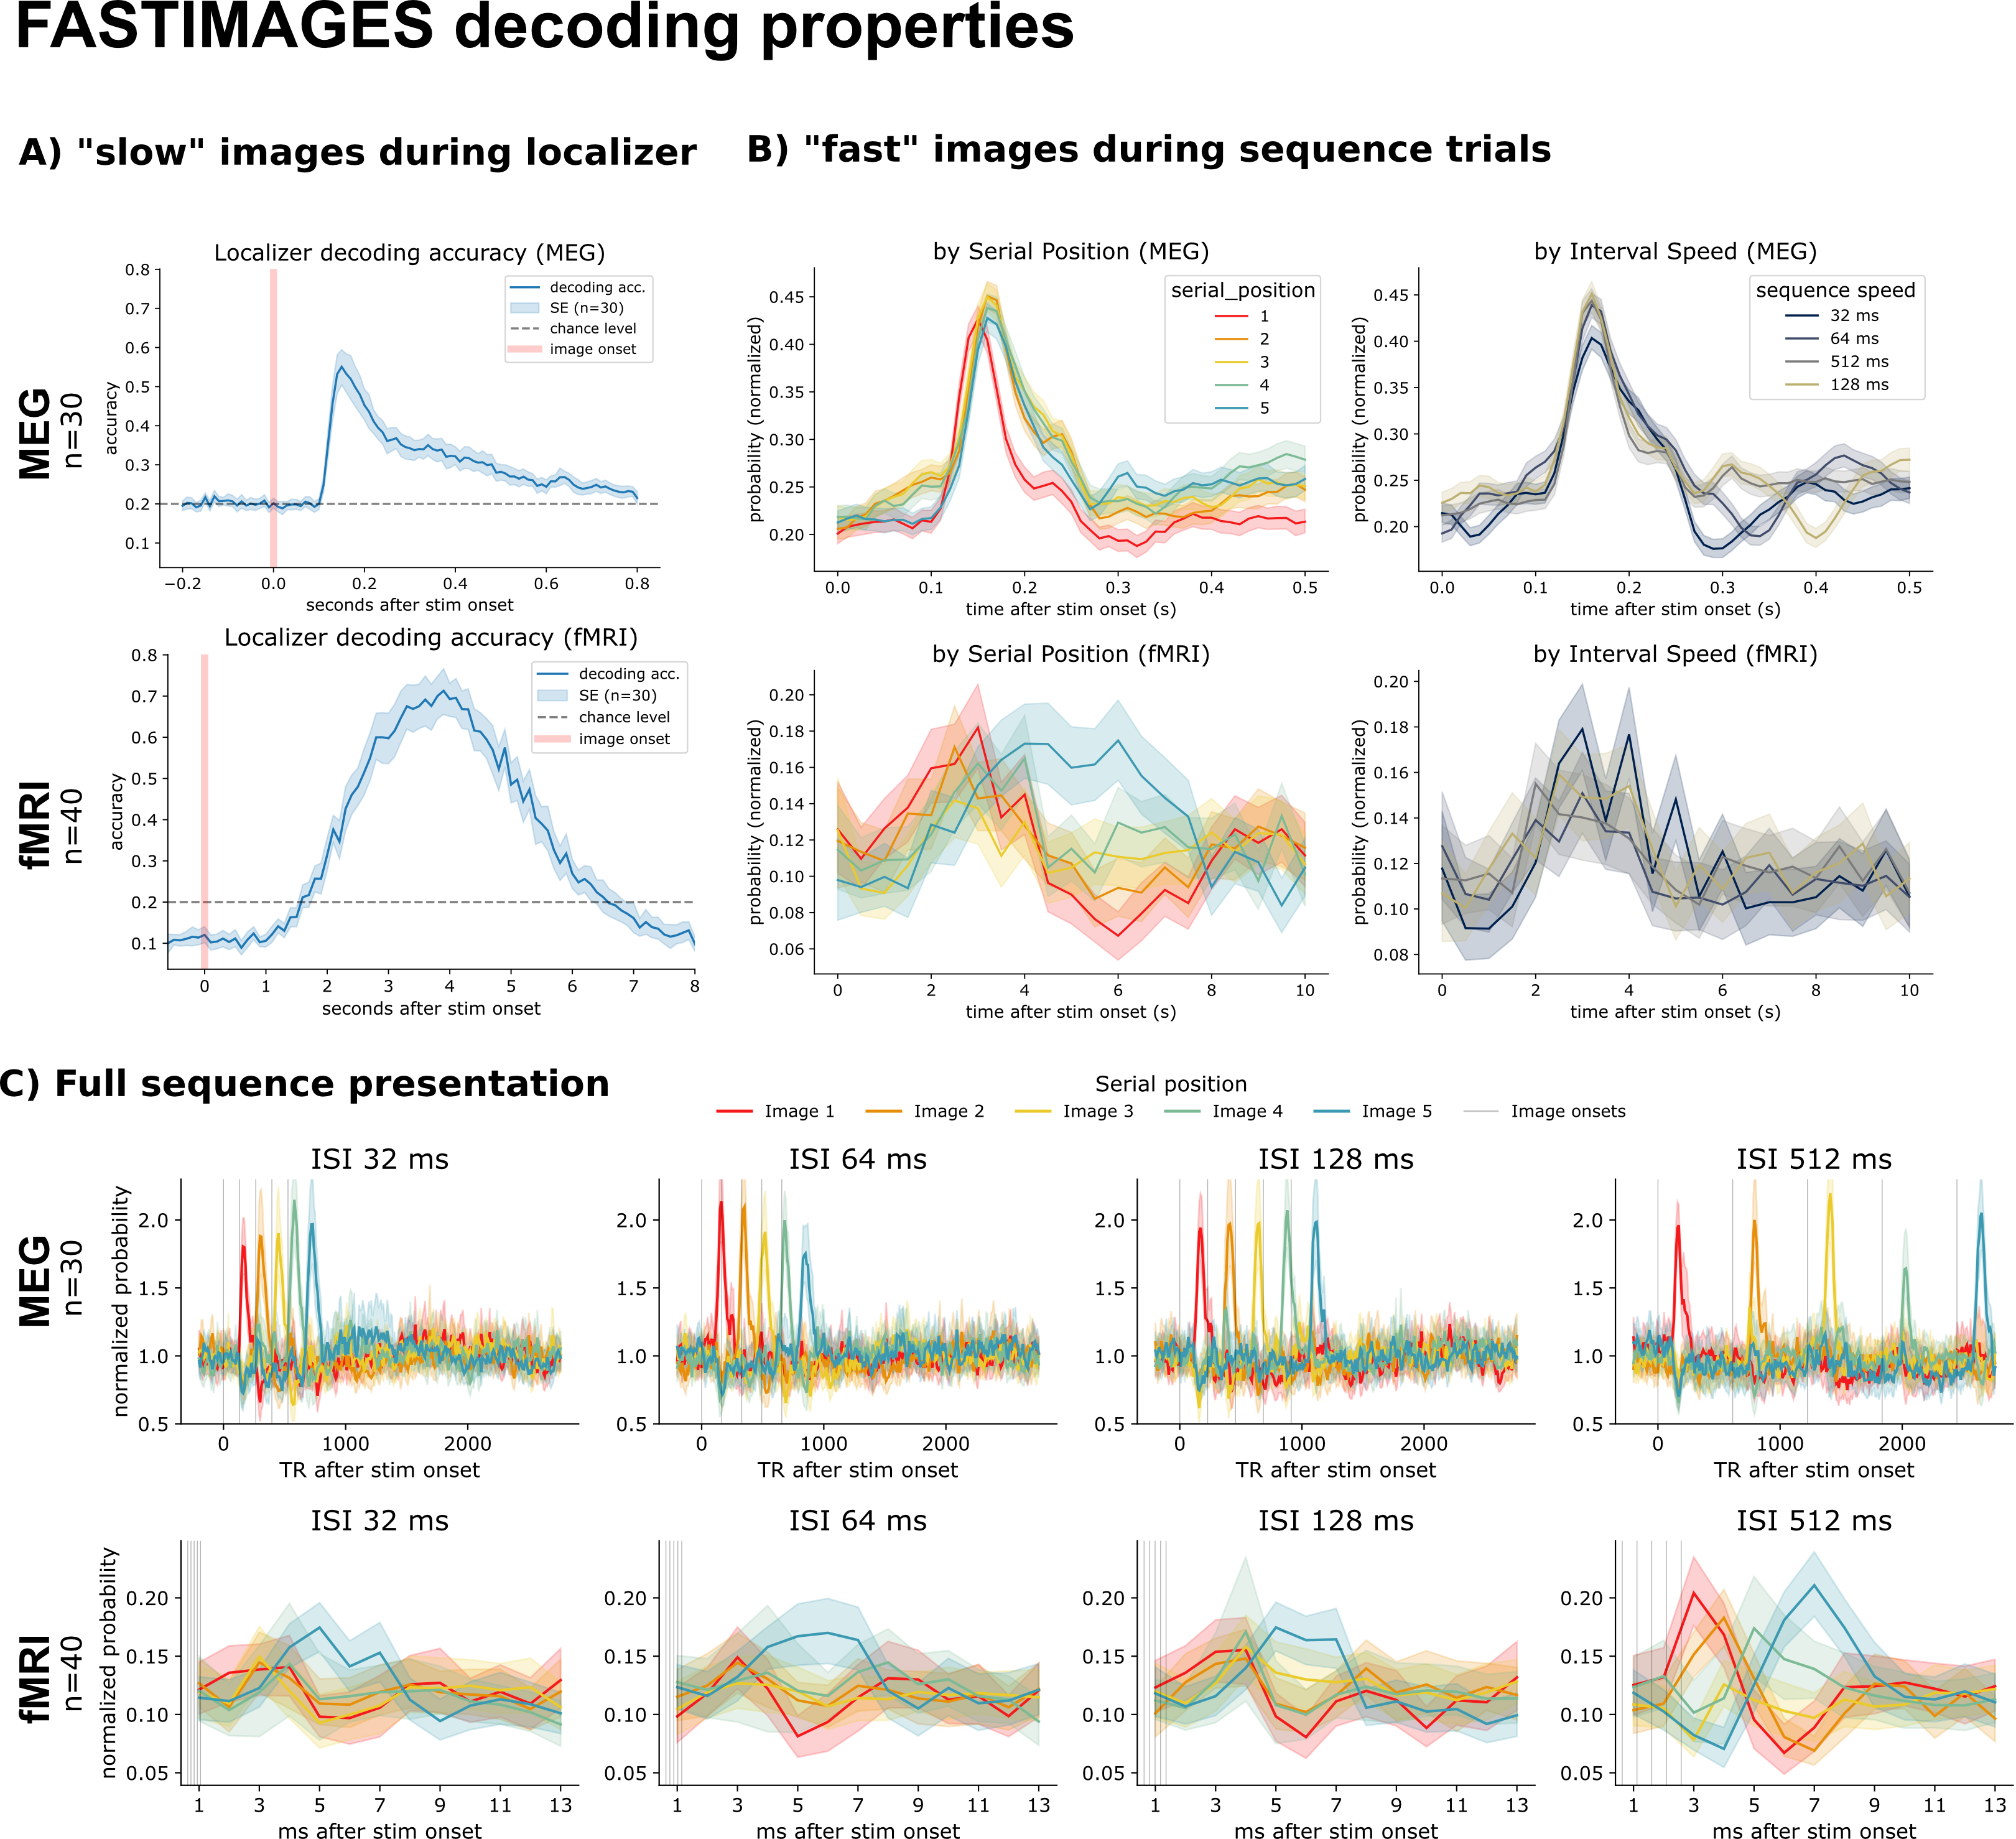
Images are robustly decodable in both modalities
Cross-validated decoders trained at each time point clearly surpassed chance (20%): peak accuracy reached ~55% in MEG (around 150 ms after onset, with a rapid rise and slow decay) and ~70% in fMRI (peaking around 4 s, reflecting the slower hemodynamic response). During the fast sequences, the presented order is visible by eye in the averaged decoded probabilities — even in the fastest MEG condition.
Figure 3. Decoding of the slow (localizer) and fast (sequence) trials. A) Localizer decoding accuracy across time. B) Decoded probabilities during sequences, aligned on image onset, split by serial position and by speed. C) Mean decoded probabilities during the fast sequences, with the presented order visible in the staggered peaks. MEG (upper) and fMRI (lower).
Benchmarking TDLM and SODA
TDLM detects every sequence speed in MEG
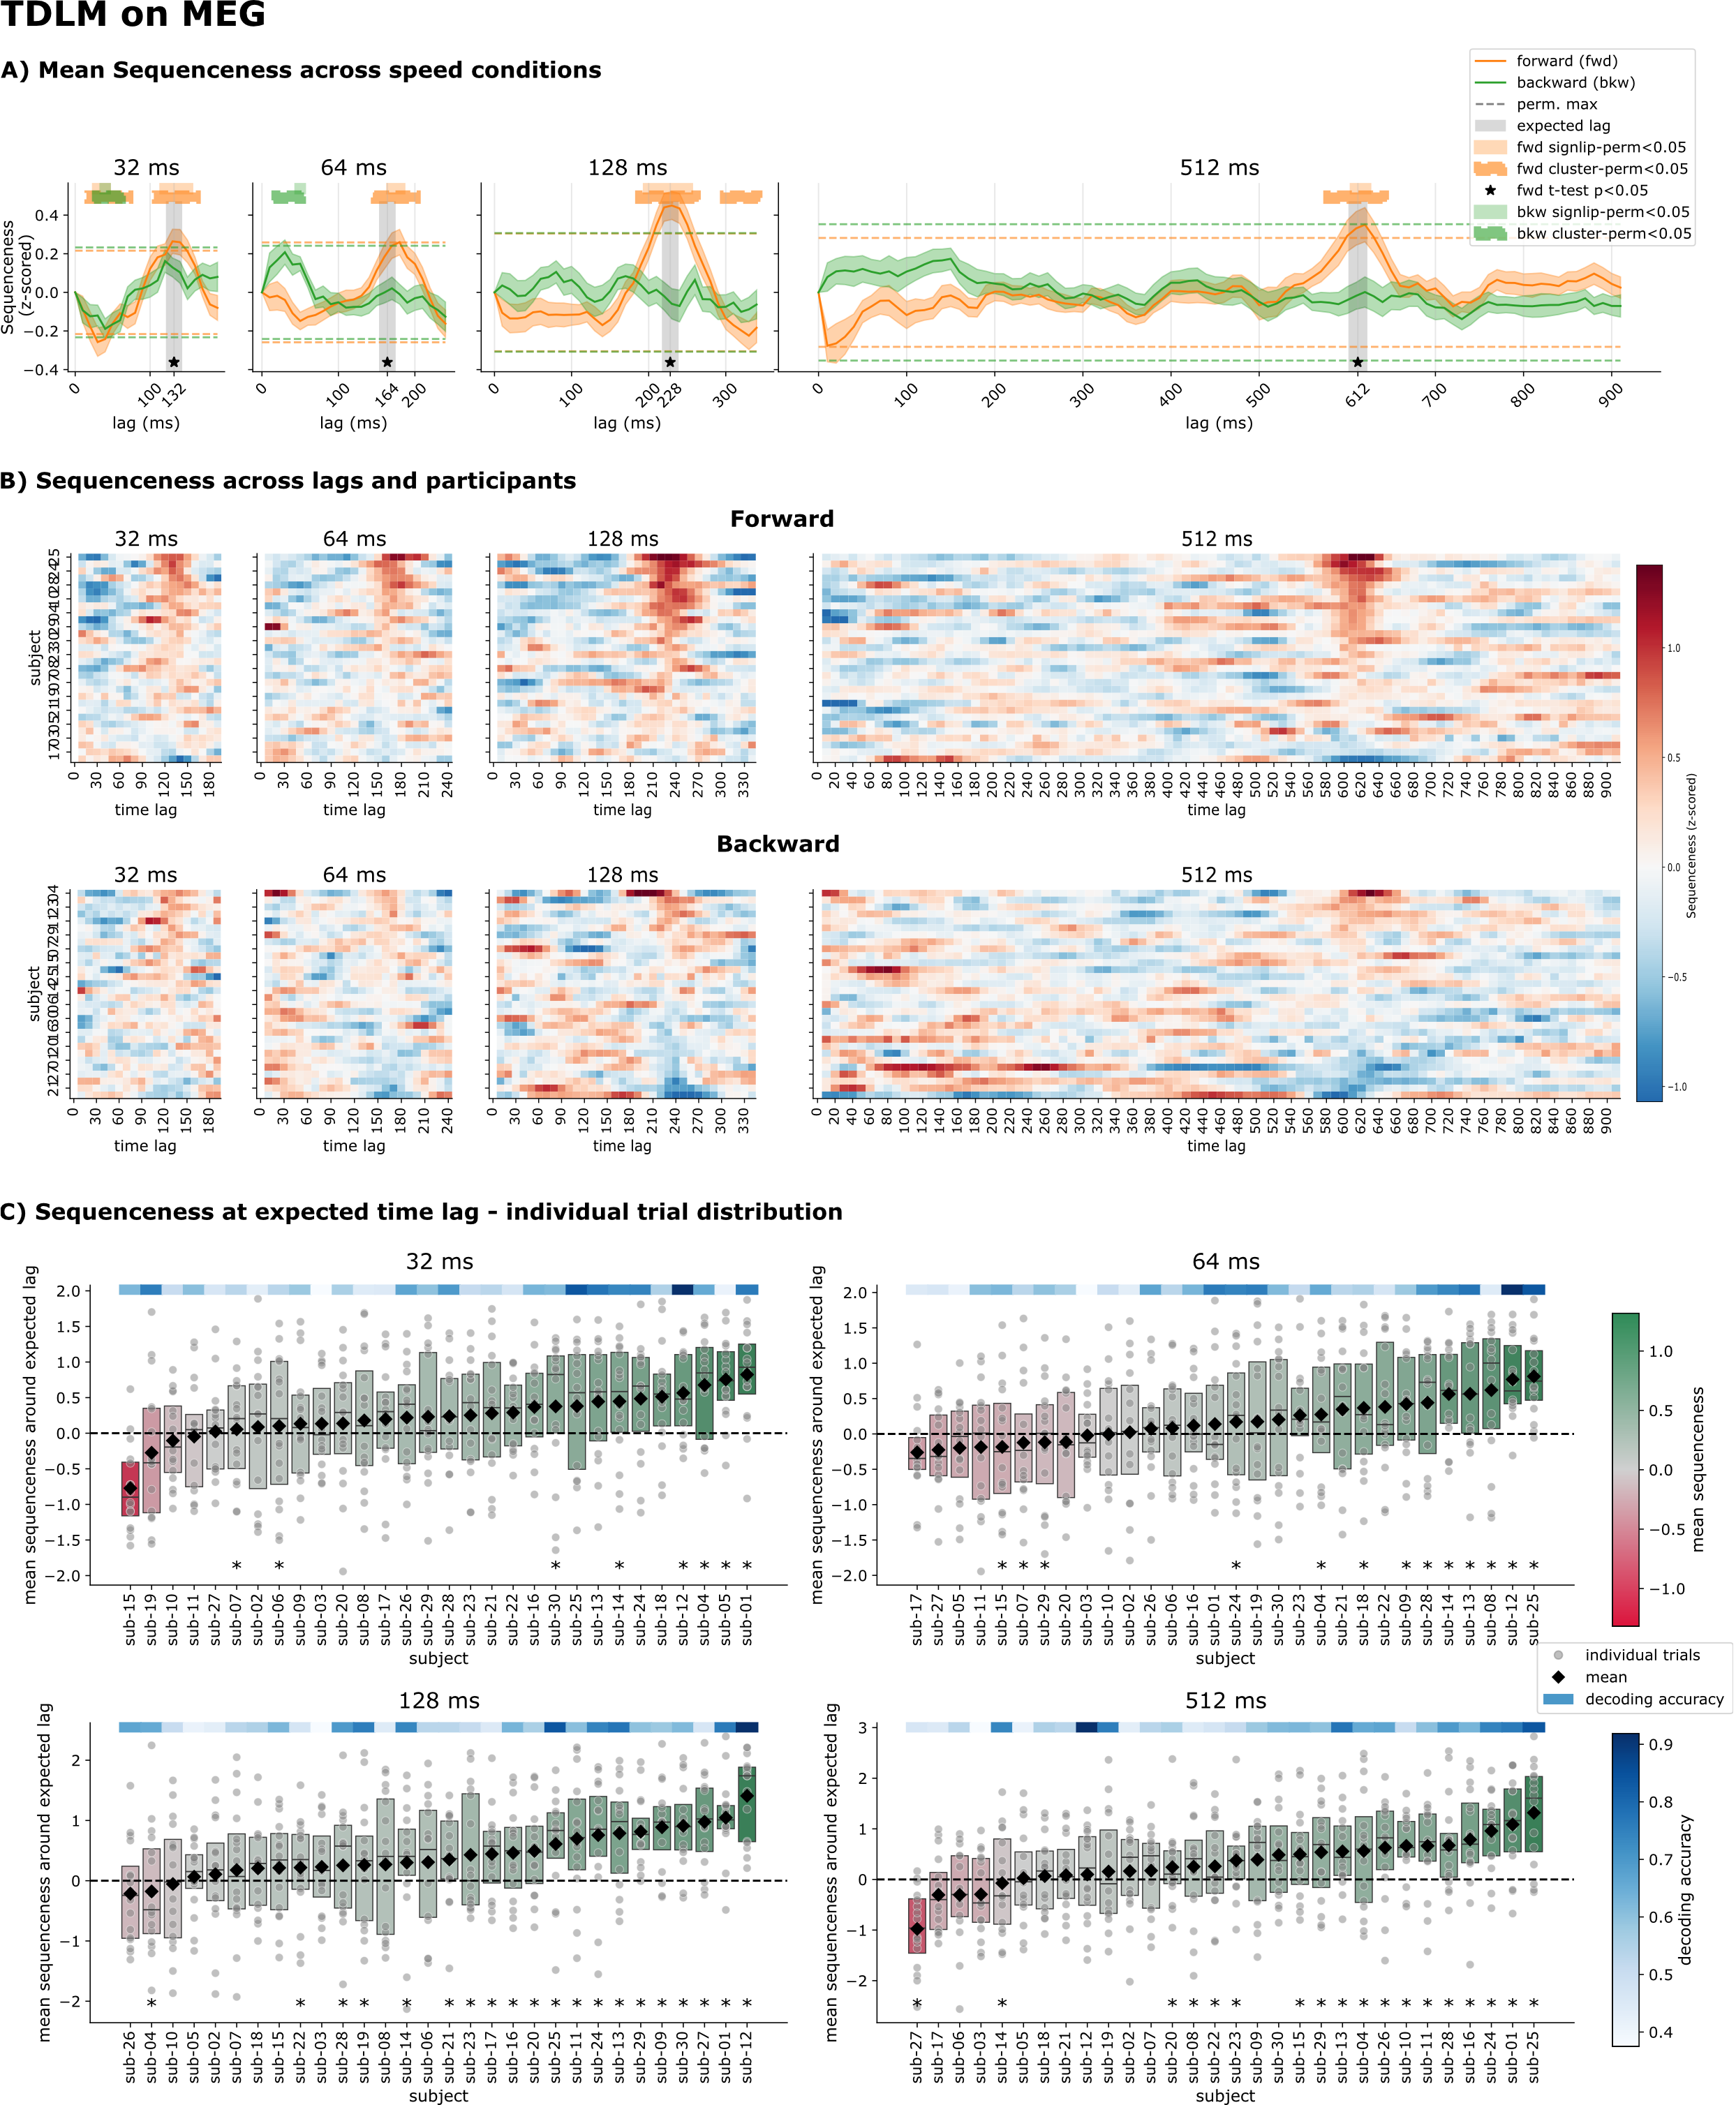
Applied to the MEG sequence trials, TDLM produced clear sequenceness peaks at the expected time lag in all four speed conditions, surpassing significance for a t-test, a sign-flip permutation test and a cluster-permutation test. Between-participant variance was high, however: only about half of participants reached individual significance, and sequenceness was strongly correlated with each participant's decoder quality (r = 0.70) but not with their behavioural performance. This underlines that TDLM should be interpreted at the group, not the individual, level.
Figure 4. TDLM on MEG. A) Mean sequenceness across speed conditions, with peaks at the expected lag. B) Sequenceness correlates with decoding accuracy (left) but not behaviour (right). C) Group-level forward/backward sequenceness with three statistical tests. D) Per-participant forward sequenceness. E) Per-trial and per-participant sequenceness at the expected lag.
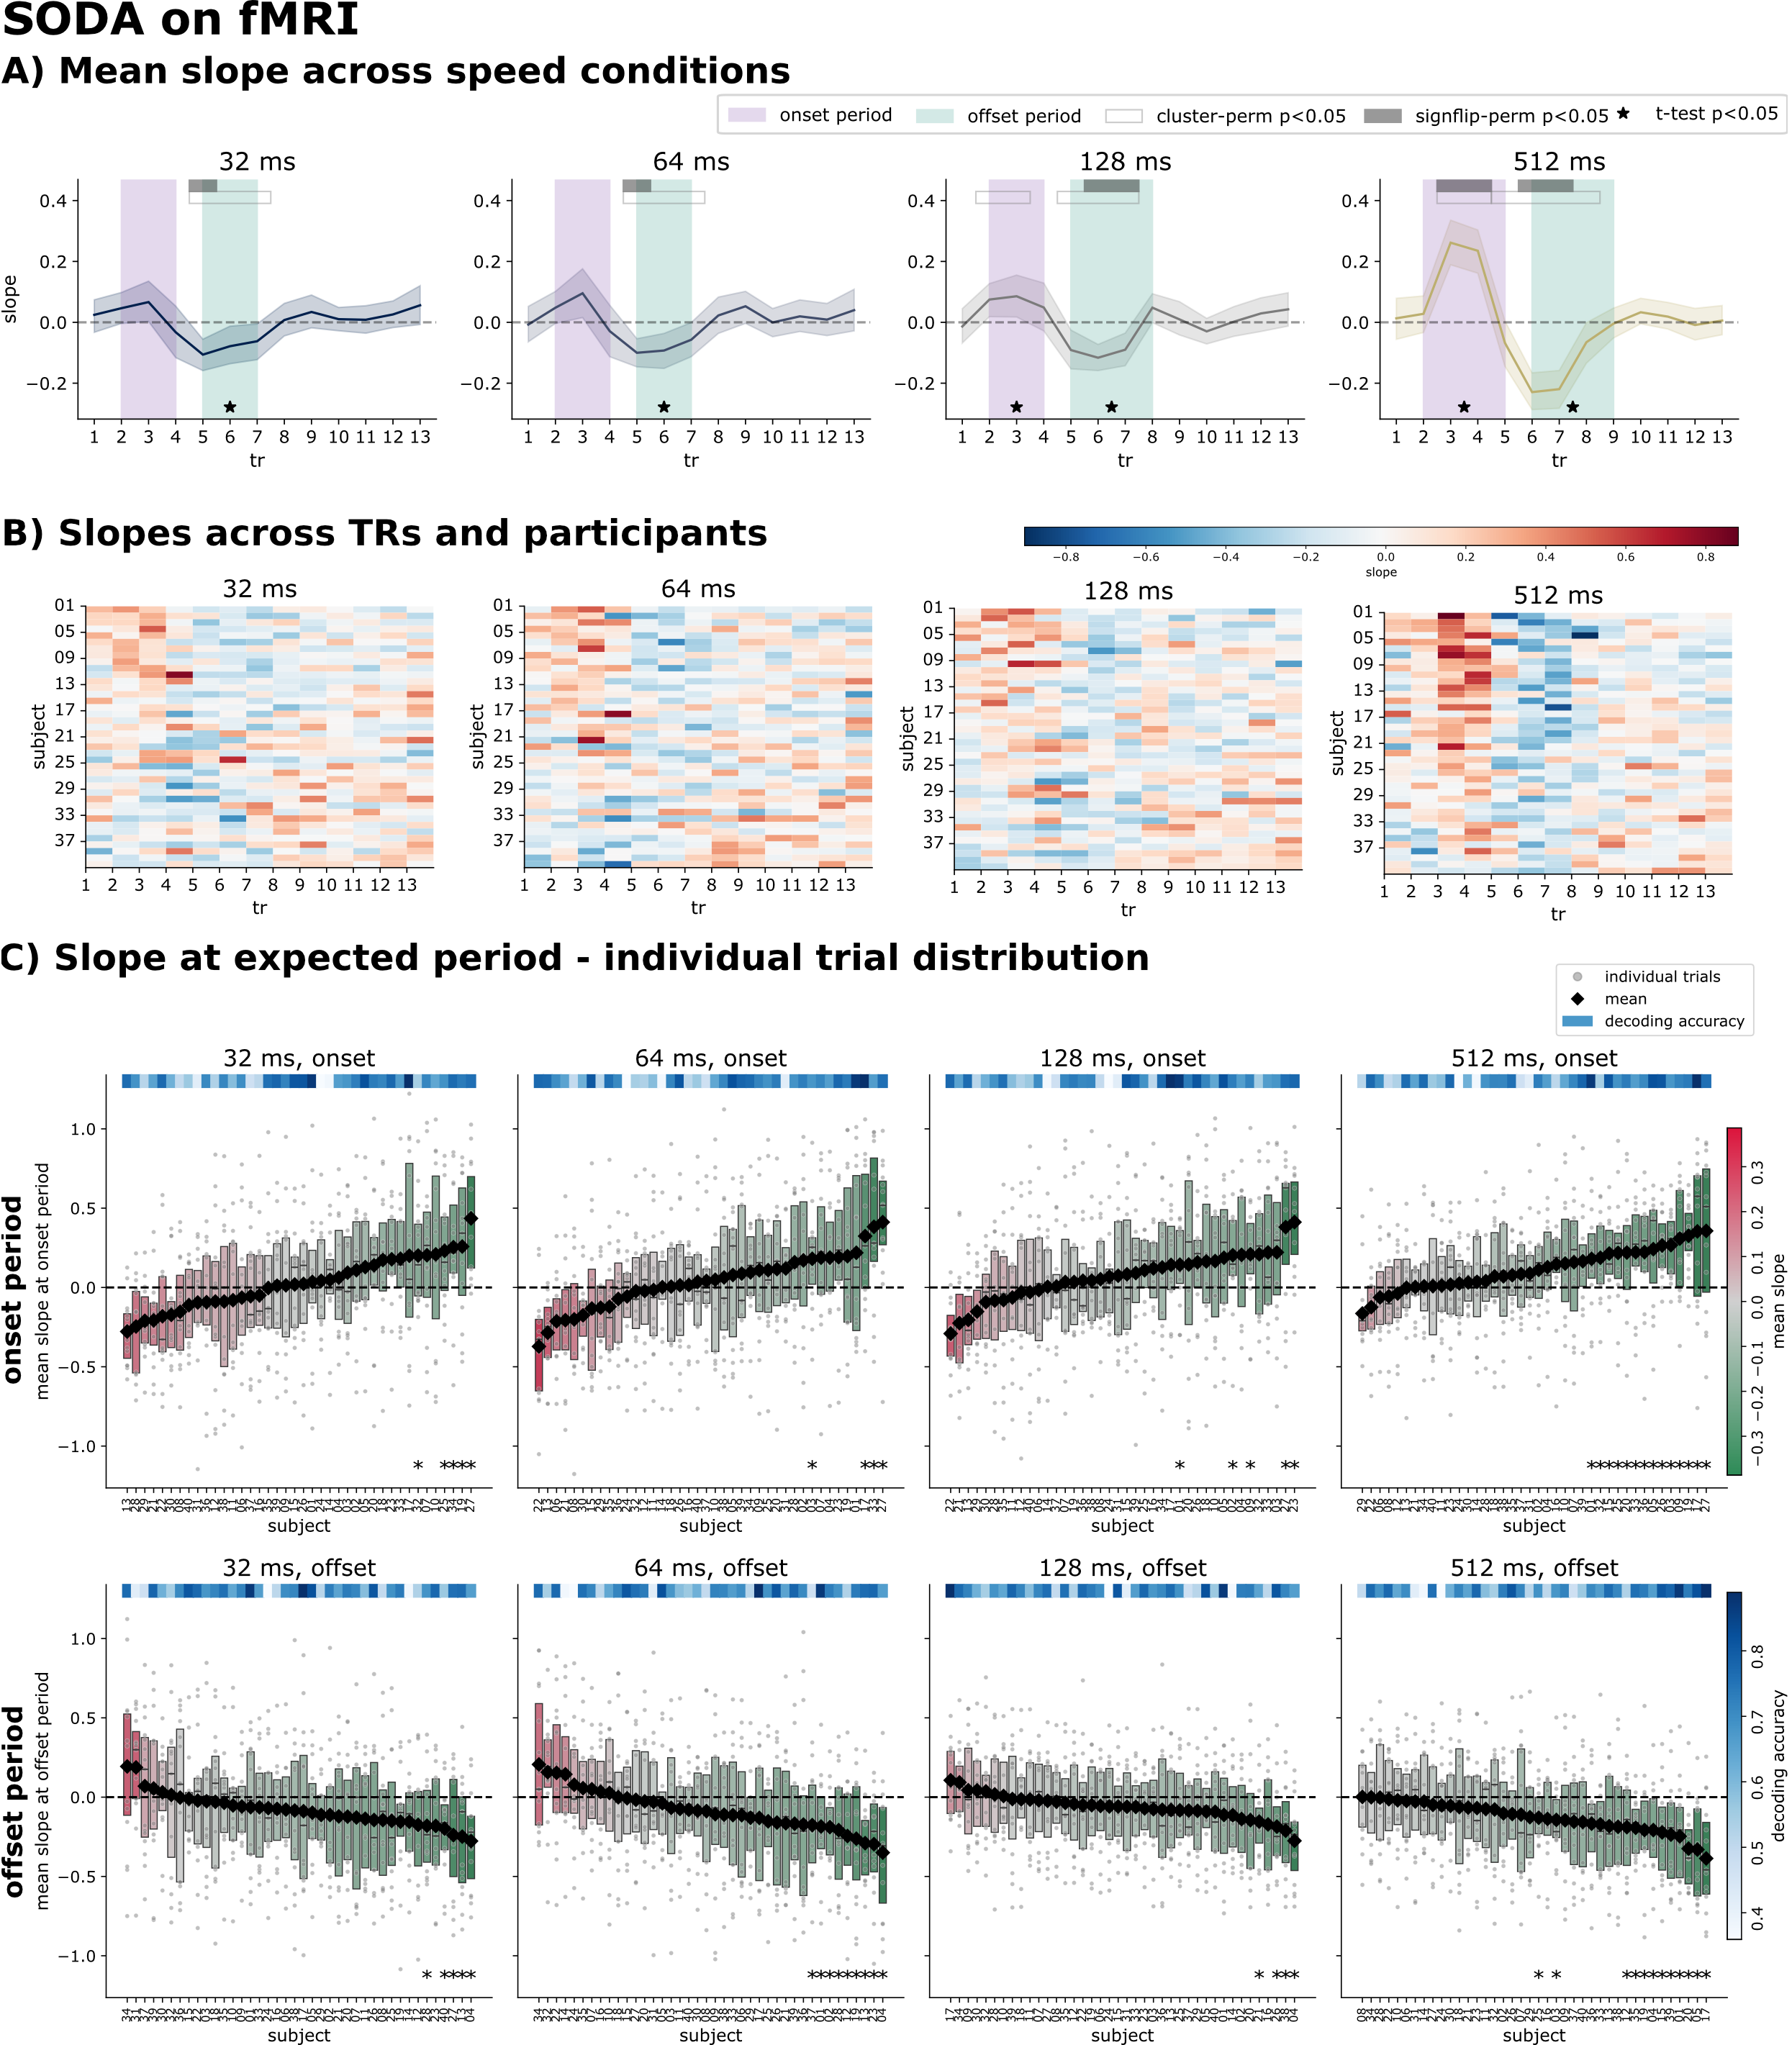
SODA recovers sequences in fMRI, driven by the offset period
Applied to the fMRI sequence trials, SODA showed the characteristic onset (negative) and offset (positive) slope dynamics. The offset period was significant in all speed conditions, while the onset period was harder to detect and only reached significance for the slower speeds. As in MEG, slope magnitude correlated with decoder quality but not behaviour. Notably, the theoretically derived onset/offset windows only partially overlapped the empirically significant clusters.
Figure 5. SODA on fMRI. A) Regression slopes over time per speed condition. B) Correlation of slopes with decoding accuracy and behaviour. C) Group-level slopes with onset/offset periods and three statistical tests. D) Per-participant slopes. E) Per-trial and per-participant onset and offset slopes.
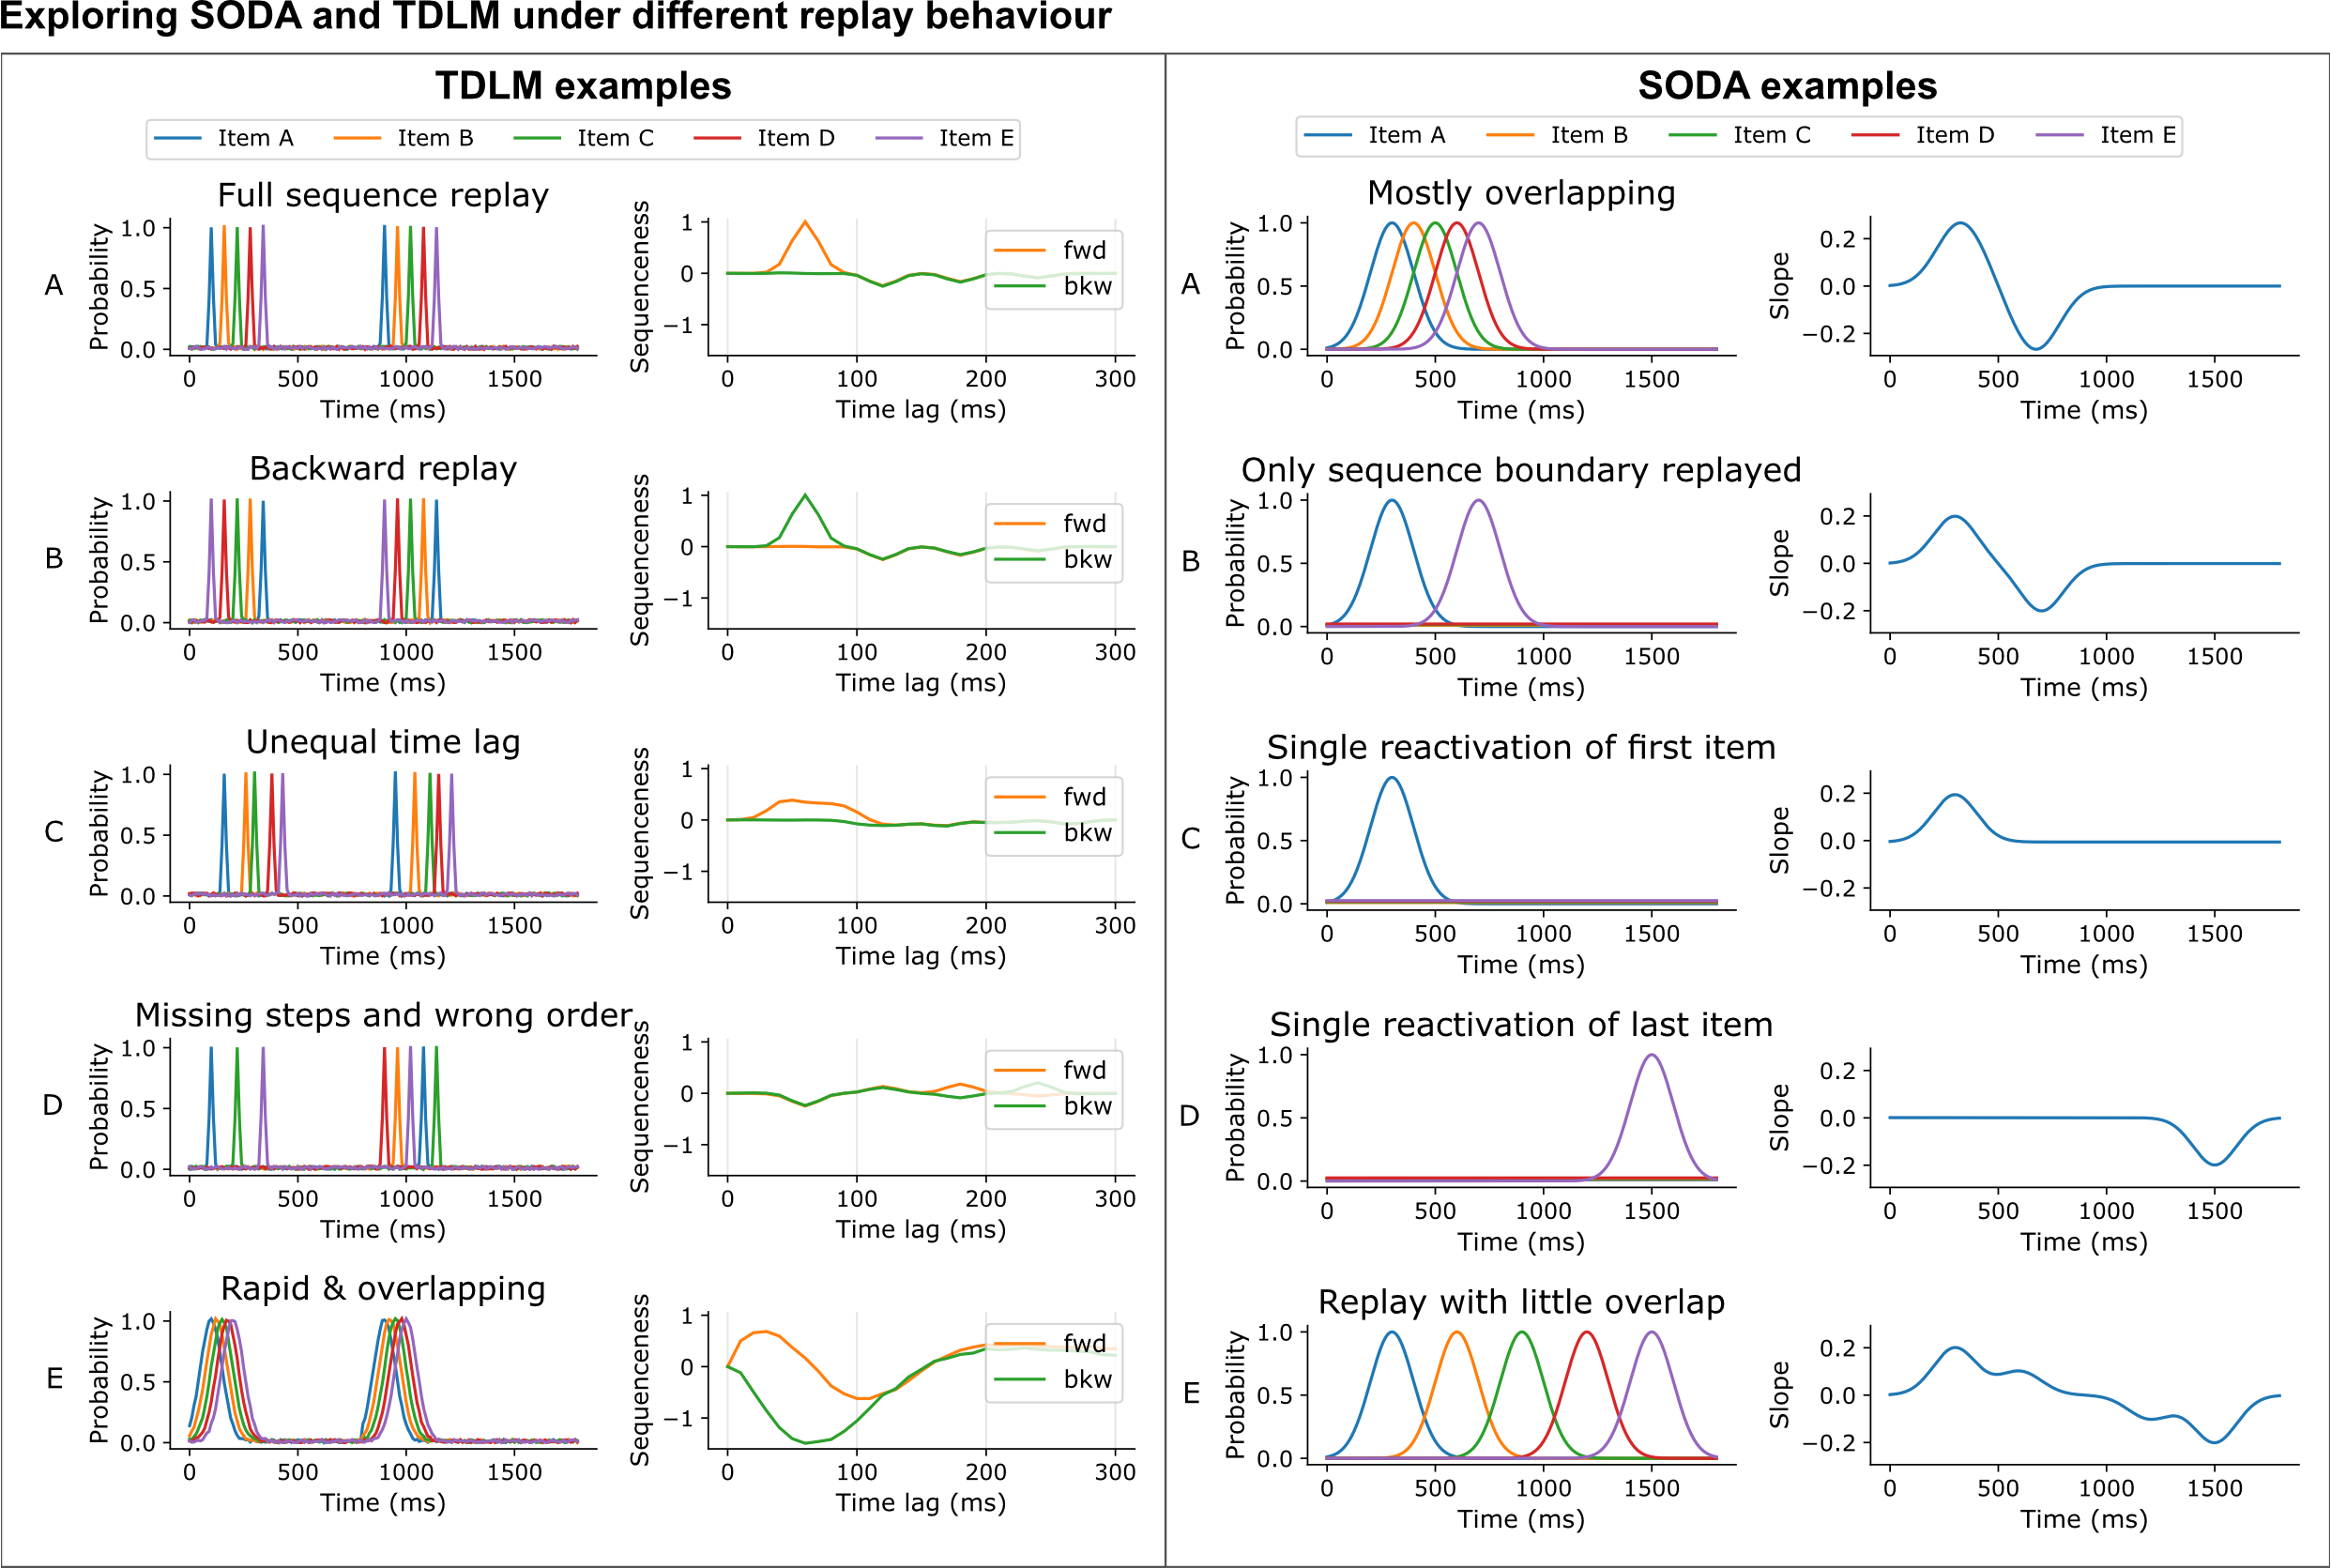
How each method behaves when its assumptions are bent
To build intuition, we ran both methods on contrived examples that partly violate their assumptions. TDLM produces a sharp peak only when the inter-item lag is constant, and smears or vanishes when lags vary, items are missing, or the order is wrong. SODA, because it is dominated by the first and last items of the sequence, can produce a convincing onset/offset signature even from partial sequences — making it robust to outliers but harder to interpret directionally.
Figure 6. Behaviour of TDLM (left) and SODA (right) under controlled, assumption-bending scenarios.
Cross-modality transfer is challenging
Each method struggles in the other's modality. SODA on MEG finds onset peaks but no genuine offset phase, because MEG reactivations decay too fast to overlap — though this very property makes SODA a promising candidate for detecting fast "clustered" reactivation. TDLM on fMRI cannot recover any of the benchmark sequences, since the TR (1.25 s) is slower than the sequences; it only succeeds for a very slow 2148 ms condition, and only when trials are averaged.
Figure 7. SODA applied to MEG sequences. Observable offset periods stem from singular strong activations rather than genuine sequence replay.
Figure 8. TDLM applied to fMRI. No benchmark speed is recoverable; only the very slow 2148 ms condition reaches significance (right).
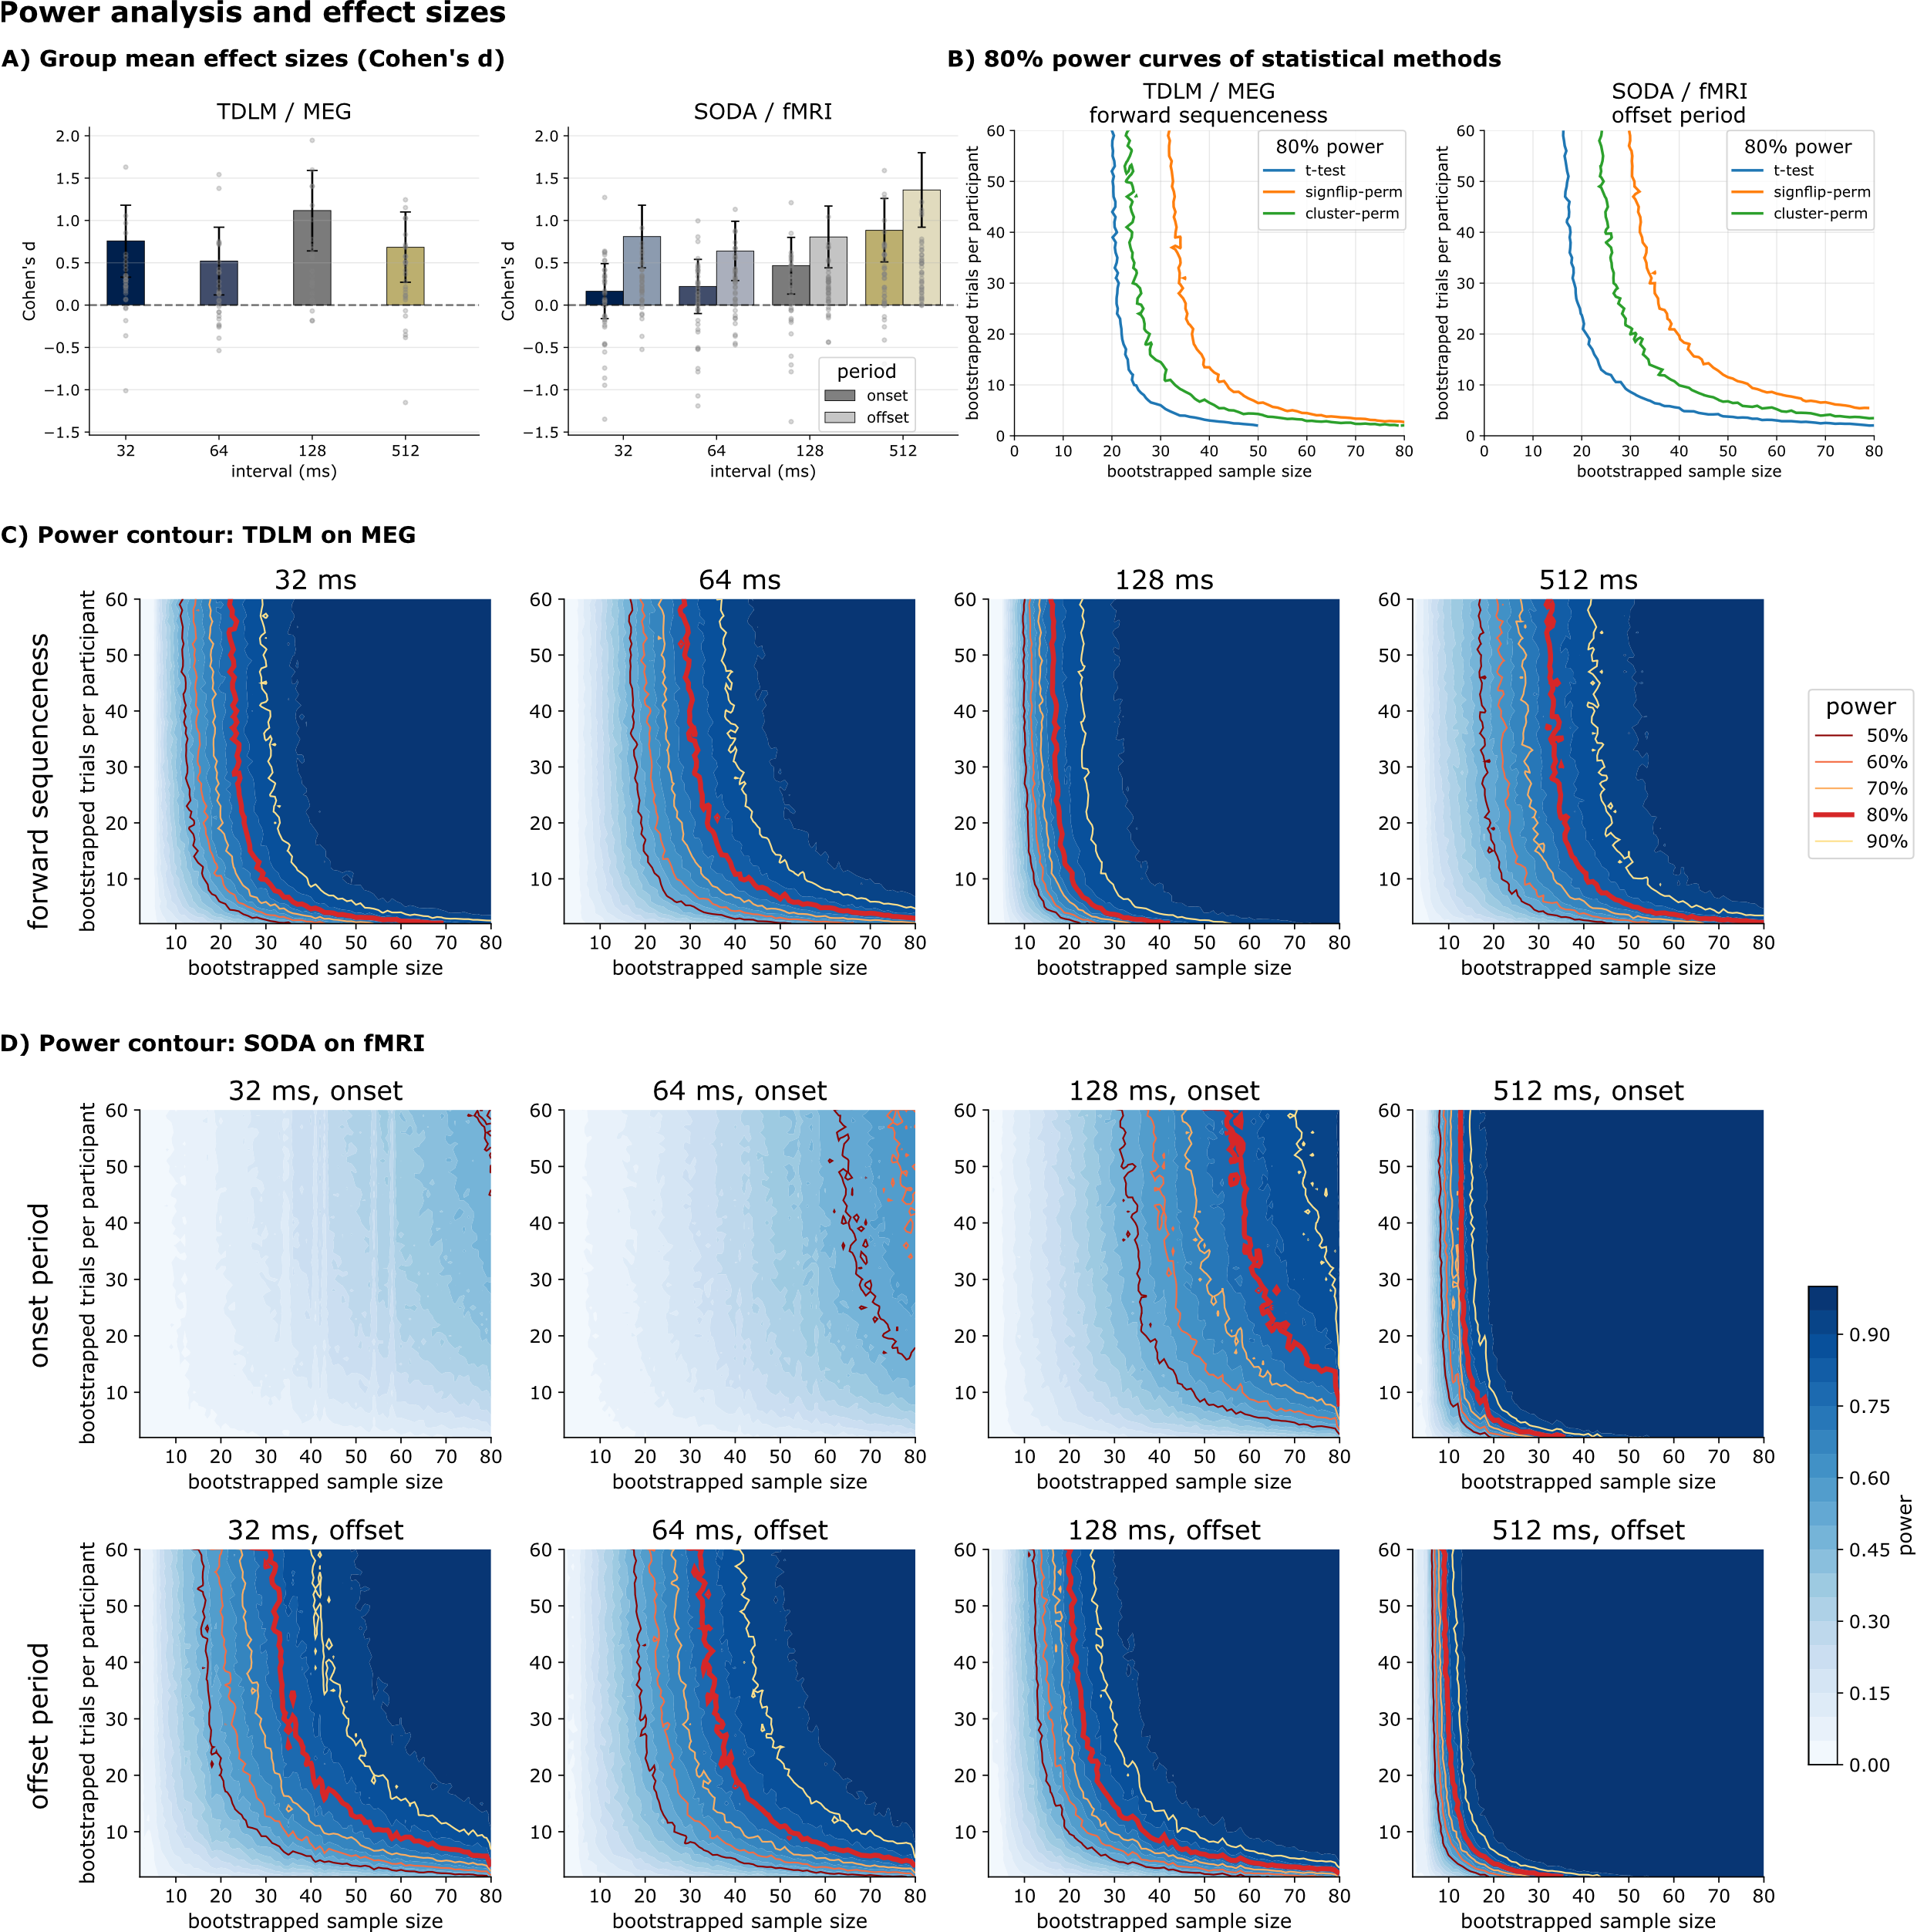
Comparable effect sizes and power in their native modality
Across speed conditions, TDLM showed stable medium effect sizes (mean Cohen's d = 0.77). SODA effect sizes were speed- and period-dependent (offset mean d = 0.9), and a combined onset+offset measure markedly increased both effect size and power. In this idealized, stimulus-driven benchmark — an absolute best-case scenario — a bootstrap analysis suggested that even roughly 20 participants and 20 trials are needed to reach 80% power, and only when the expected lag or period is known in advance. Real replay studies, with weaker, non-time-locked signals and unknown timing, should expect to need substantially more. When timing is unknown, the cluster-permutation test was consistently more powerful than a sign-flip permutation test — our recommended best practice.
Figure 9. Effect sizes and bootstrap power. A) Between-participant Cohen's d. B) 80% power lines. C–E) Power contour plots across bootstrapped participants and trials for TDLM, SODA, and SODA's combined measure.
Conclusion
FASTIMAGES validates that TDLM and SODA each perform well when the data meet their assumptions — temporally resolved peaks for TDLM (MEG) and overlapping responses for SODA (fMRI) — but that they do not transfer readily to the other modality. The two methods are therefore complementary rather than interchangeable. Across both, decoder quality emerged as the dominant limiting factor, suggesting clear room for improvement. Because the benchmark uses stimulus-driven, time-locked sequences decoded by classifiers trained on the same stimuli, it represents an upper bound on detection sensitivity.
We suggest using FASTIMAGES as:
a sanity check for existing replay-detection pipelines,
a testbed for developing and calibrating new methods,
and a shared reference point for making sequence detection in human neuroimaging more robust and reproducible.
The analysis code is available on
GitHub,
and the BIDS datasets are hosted on GIN:
MEG and
fMRI.