Experiment Visualization for "Challenges in Replay Detection by TDLM in Post-Encoding Resting State"

Central Institute of Mental Health
, University of Hamburg
, University of Tübingen
, UCL
https://doi.org/10.7554/eLife.108023.3

Abstract

Using temporally delayed linear modelling (TDLM) and magnetoencephalography (MEG), we investigated whether items associated with an underlying graph structure are replayed during a post-learning resting state. In these same data, we previously provided evidence for replay during on-line (non-rest) memory retrieval. Despite successful decoding of brain activity during a localizer task, and contrary to predictions, we found no evidence for replay during a post-learning resting state. To better understand this, we performed a hybrid simulation analysis in which we inserted synthetic replay events into a control resting state recorded prior to the actual experiment. This simulation revealed that replay detection using our current pipeline requires an extremely high replay density to reach significance (>1 replay sequence per second, with “replay” defined as a sequence of reactivations within a certain time lag). Furthermore, when scaling the number of replay events with a behavioural measure, we were unable to induce a strong correlation between sequenceness and this measure. We infer that even if replay was present at plausible rates in our resting state dataset, we would lack statistical power to detect it with TDLM. Finally, contrasting our novel hybrid simulation to existing purely synthetic simulations indicated that the latter approaches overestimate the sensitivity of TDLM. We discuss approaches that might optimize the analytic methodology, including identifying boundary conditions under which TDLM can be expected to detect replay. We conclude that solving these methodological constraints will be crucial for optimizing the non-invasive measurement of human replay using MEG.

Jump to Results Summary

Experiment overview

All parts of the experiment were run in an MEG while recording. The general structure of the experiment was:

  1. Control Resting State (8 minutes eyes closed)
  2. Localizer (10 images in 500 trials)
  3. Learning Block (2-6 blocks of 12 trials)
  4. Resting State (8 minutes eyes closed)
  5. Retrieval (1 block of 12 trials)
Click to expand paradigm details

1. Control Resting State

An 8-minute resting state was measured, participants instructed to close their eyes and to not think of anything in particular. Data of this session was later used for basis of the hybrid simulation.

2. Localizer

10 images, diverse in color&shape were presented to participants. First the word belonging to the image was presented auditorily, then either a matching or non-matching image was shown. participants were instructed to press a button in case of mismatch (attention check). This data was later used to train a classifier on these images.

In total, 500 such trials were recorded, with 60 trials being mismatches

all 10 stimuli visualized

Video of screen during localizer (click to play, with audio)

3. Learning

The ten images were embedded into a graph structure. The graph had duplicates such that participants could not rely on simple pair-wise learning but needed to learn triplets/surrounding. Participants never

Participants performed blocks until they reached 80% correct trials. Regardless, they performed a minimum of 2 and a maximum of 6 blocks.

Here's a top-down view of the sequence (participants were never told about this hidden structure)

all 10 stimuli visualized

GIF of screen during learning block

sequence learning

4. Post-Learning Resting State

Another 8-minute resting state was measured, in which we expected consolidation of the learned material.

5. Retrieval

One block of 12 trials (each sequence position once) was shown to test retrieval performance after resting state. No feedback was provided during this block.

GIF of screen during retrieval block

sequence learning


Results summary

Study 1: No replay found in post-learning rest

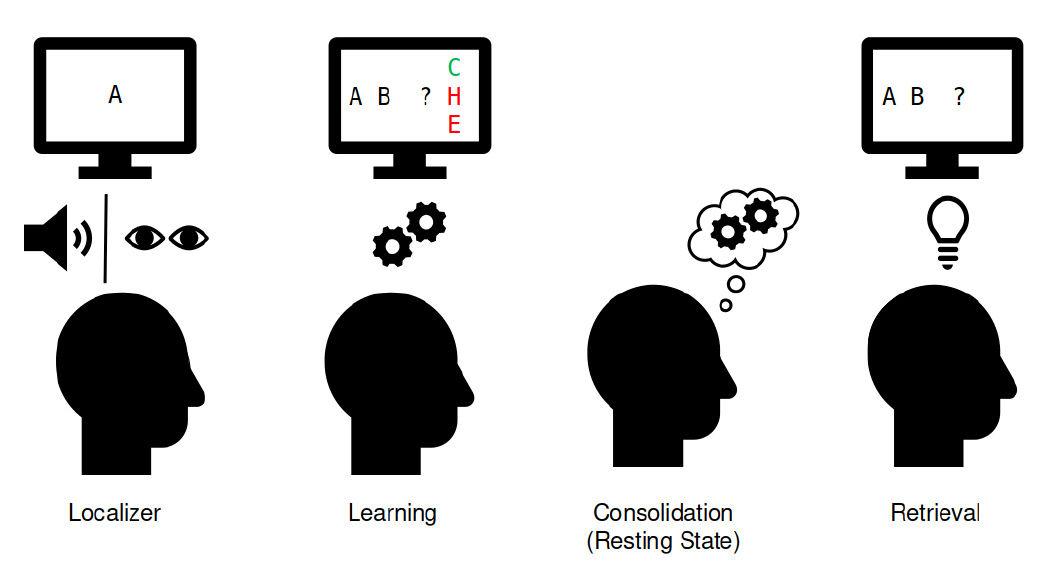
Localizer: Robust Decoders

We determined the timepoint of best decoding accuracy by running a cross-validation across time. Peak decoding accuracy was at 42% accuracy (chance = 10%) at 210 milliseconds after stimulus onset. We trained one logistic regression classifier per class per participant on data from that timepoint (one-vs-all classification).

Behavioural results and localizer decoding accuracy
Figure 1. Left: Memory performance of participants per block. Middle: Decoding accuracy for each item (chance = 10%) across time. Error bars show ±1 SEM. Right: Decoding heatmap for training at specific time point and testing on another.

No Sequenceness During Post-Learning Rest

We applied the trained decoders to the control resting state and the post-learning resting state, expecting replay of sequences to occur during post-learning resting state. The result (a probability estimate of each 10 images/classes for each time point of the resting state) was fed into TDLM to detect sequentiality of reactivations. However, we found no forward or backward sequenceness within either 8-minute resting state.

Sequenceness curves
Figure 2. Forward (orange) and backward (green) sequenceness traces stay within the permutation confidence envelope for both control and post-learning resting state.

Study 2: Hybrid Simulation

Simulated Replay Insertion

We extracted activity patterns for each item by creating the average ERP of each item and subtracted the ERP of all other items. Using this process we were able to get the subtle item-specific pattern minus the visual evoked potential that is common to general visual processing. We inserted these momentary patterns (each spanning ~10 ms) into the control resting state.

Replay insertion schematic
Figure 3. Schematic of replay event generation and embedding into MEG data.

Implausibly High Replay Rates Required

Next we varied the amount of replay that was inserted into the resting state, from zero up to 200 events per minute. TDLM reached 95% detection power only when replay density exceeded ≥80 events per minute (≈1.3 Hz)—an order of magnitude above hippocampal sharp-wave ripple rates (usually ~2–3 per minute, reported up to 20 events per minute).

Power curve vs replay rate
Figure 4. Left: Statistical significance of TDLM as a function of injected replay rate. Only with 80 events per minute significance can be reached, more stringent criteria only at 150 events per minute. Right: 4 sample curves for density of 0, 40, 80 and 120 events per minute.

Behaviour ≠ Sequenceness

Some studies correlate sequenceness measures with behavioural measures. We simulated this dependency by scaling replay counts with each participant's retrieval performance. However, this produced no reliable correlation. The fluctuation between participants' baseline scores was already higher than any induced effect.

Correlation scatter
Figure 5. Left: When inserting more replay for participants with lower memory performance (green), no correlation can be induced. Only when maximizing the scaling rule (blue) and inserting no replay for the best and maximum replay for the worst participants, correlations are found at 200 events per minute. Right: Even in the baseline condition (with no replay inserted), the correlation fluctuates significantly based upon which time point is used for its computation.

Previous Simulations Overestimate Replay

Previously TDLM simulations often demonstrated significant sequenceness by injecting 2000–2400 events per minute, two orders of magnitude above in-vivo estimates. Our replication of these defaults confirms that such extreme densities virtually guarantee significance, potentially setting unrealistic expectations for empirical work. Indeed, when using the original simulation code and injecting a more realistic estimate of 15 events per minute, significance is barely reached.

Legacy simulation outcomes
Figure 6. Upper: Legacy simulations with 2000 events per minute. Lower: The same code run with more realistic estimate of 15 events per minute barely reaches significance.

Pattern Discriminability Explains the Difference

To understand this difference, we compared decoder output distributions when a true pattern was present. Pattern discriminability was lowest in the empirical localizer, intermediate in the hybrid simulation, and highest in the synthetic simulation. Greater discriminability lead to more extreme classifier outputs, inflating sequenceness. This highlights the necessitiy to simulate under realistic conditions.

Pattern discriminability analysis
Figure 7. Left: Classifier probability distributions for localizer, hybrid, and synthetic simulation. Middle: Wasserstein distance per participant across conditions. Right: Sequenceness increases with better pattern discriminability.

Conclusion and Recommendation

In our study we showed that TDLM was not able to detect replay in our experimental setup. Using a hybrid simulation approach we varied the amount of replay and found that implausible rates would be necessary for detection. However, in certain contexts TDLM should nevertheless work well (e.g. limited search windows). To be applicable to longer search windows (e.g. sleep & resting state), methodological improvements need to be implemented and verified.


Additionally, we give the following recommendations for future replay studies:
  • Anchor and report replay-rate priors to SWR literature (≤20 events min−1).
  • Simulate if replay rates indicated by TDLM results can be reliably found.
  • Preregister temporal windows and decoder normalisation choices.
  • Run multiverse analyses to reveal parameter dependencies.
  • Subselect ROIs of few seconds for realistic detection, e.g. locked to oscillations.
  • Verify if classifiers transfer to other sensory modalities.